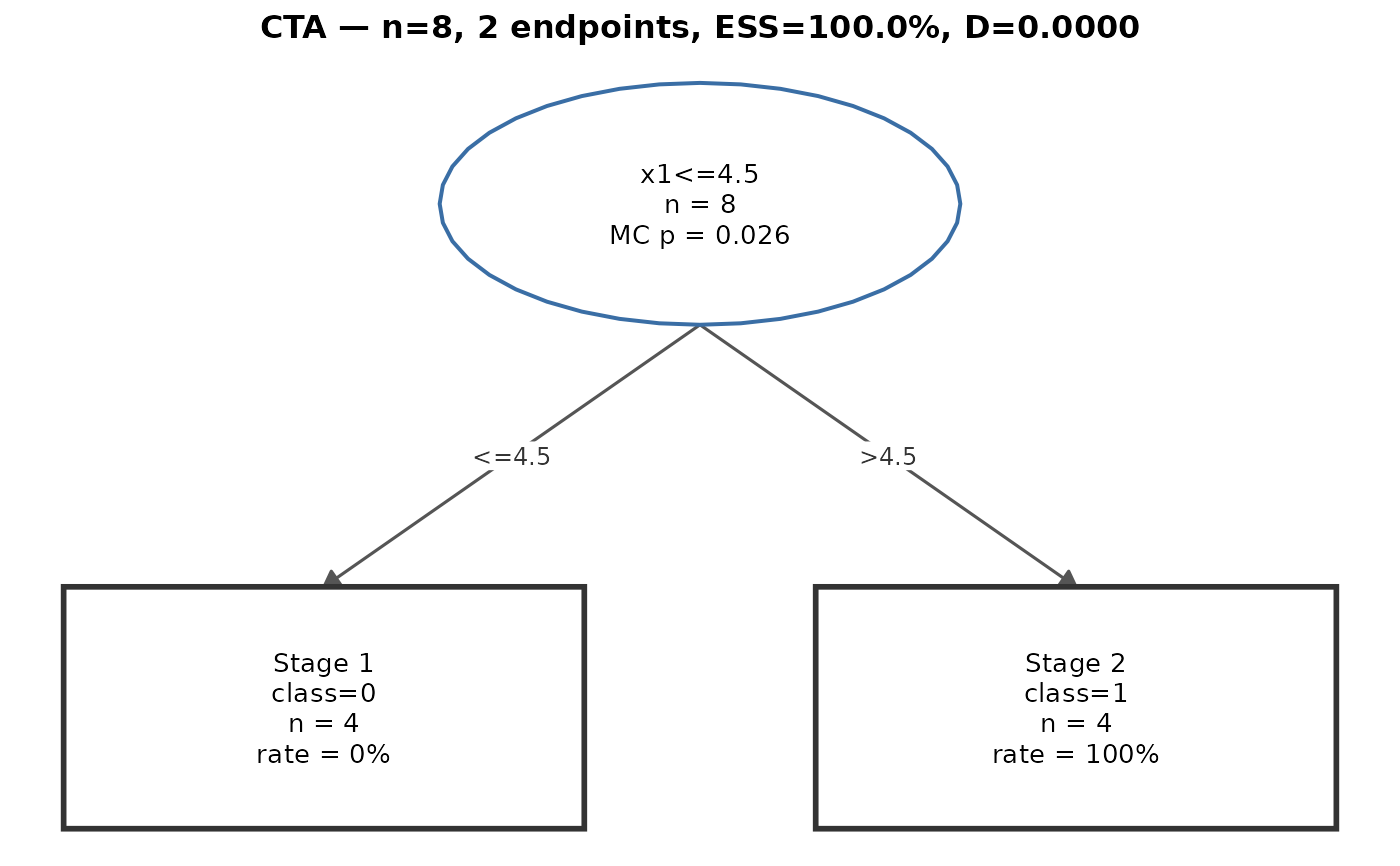
Renders a publication-quality tree diagram for a fitted CTA tree. Requires
the ggplot2 package (listed in Suggests); if unavailable, a
clear error is raised.
Usage
plot_cta_tree(
  x,
  target_class = 1L,
  color_by = c("none", "target_rate", "prediction"),
  label_detail = c("simple", "full"),
  show_node_ess = FALSE,
  show_p = TRUE,
  show_loo = TRUE,
  main = NULL,
  subtitle = NULL,
  show_rule = TRUE,
  show_metrics = FALSE,
  short_edge_labels = TRUE,
  node_text_size = 3.5,
  edge_text_size = 3.2,
  palette = NULL
)
Arguments
- x
A
cta_treeobject fromcta_fit/oda_cta_fit, or the list returned bycta_plot_data.- target_class
Integer; target class for endpoint coloring and target-rate annotation (default
1L). Ignored whenxis alreadycta_plot_dataoutput.- color_by
Character; controls leaf-node fill color.
"none"(default): white fill (B/W publication default);"target_rate": continuous gradient by target-class proportion;"prediction": discrete fill by predicted class.- label_detail
Character; node label verbosity.
"simple"(default): canonical MPE-style labels (attribute + condition + n for split nodes; Stage/class/n/rate for terminal nodes)."full": same content (reserved for future extension).- show_node_ess
Logical; if
TRUE, append the node-level ESS/WESS to split-node labels. DefaultFALSE.- show_p
Logical; if
TRUE(default), appendMC p = X.XXXto each split-node label when the MC permutation p-value is available.- show_loo
Logical; if
TRUE(default), append the LOO result to each split-node label:LOO: STABLEwhenloo = "stable",LOO p = X.XXXwhenloo = "pvalue". Nothing is shown whenloo = "off".- main
Character; plot title. Default: auto-generated from tree structure (n, endpoints, ESS/D).
- subtitle
Character; plot subtitle.
- show_rule
Logical; show branch condition labels on edges. Default
TRUE.- show_metrics
Logical; if
TRUE, appends an ESS/WESS and D line to the plot subtitle. DefaultFALSE.- short_edge_labels
Logical; if
TRUE(default), strip the attribute-name prefix from edge labels so that"x1 <= 24.5"renders as"<= 24.5".- node_text_size
Numeric; ggplot text size for node labels. Default
3.5.- edge_text_size
Numeric; ggplot text size for edge labels. Default
3.2.- palette
Named list for color overrides:
internal,low,high.NULLuses defaults.
Value
A ggplot object. Print it, modify it, or
save with ggplot2::ggsave().
Examples
# \donttest{
if (requireNamespace("ggplot2", quietly = TRUE)) {
  X <- data.frame(x1 = c(1,2,3,4,5,6,7,8),
                  x2 = c(0L,0L,1L,0L,1L,1L,0L,1L))
  y <- c(1L,1L,1L,1L,2L,2L,2L,2L)
  tree <- cta_fit(X, y, mindenom=1L, mc_iter=500L, mc_seed=42L, loo="off")
  p <- plot_cta_tree(tree)
  print(p)
}

# }
# }