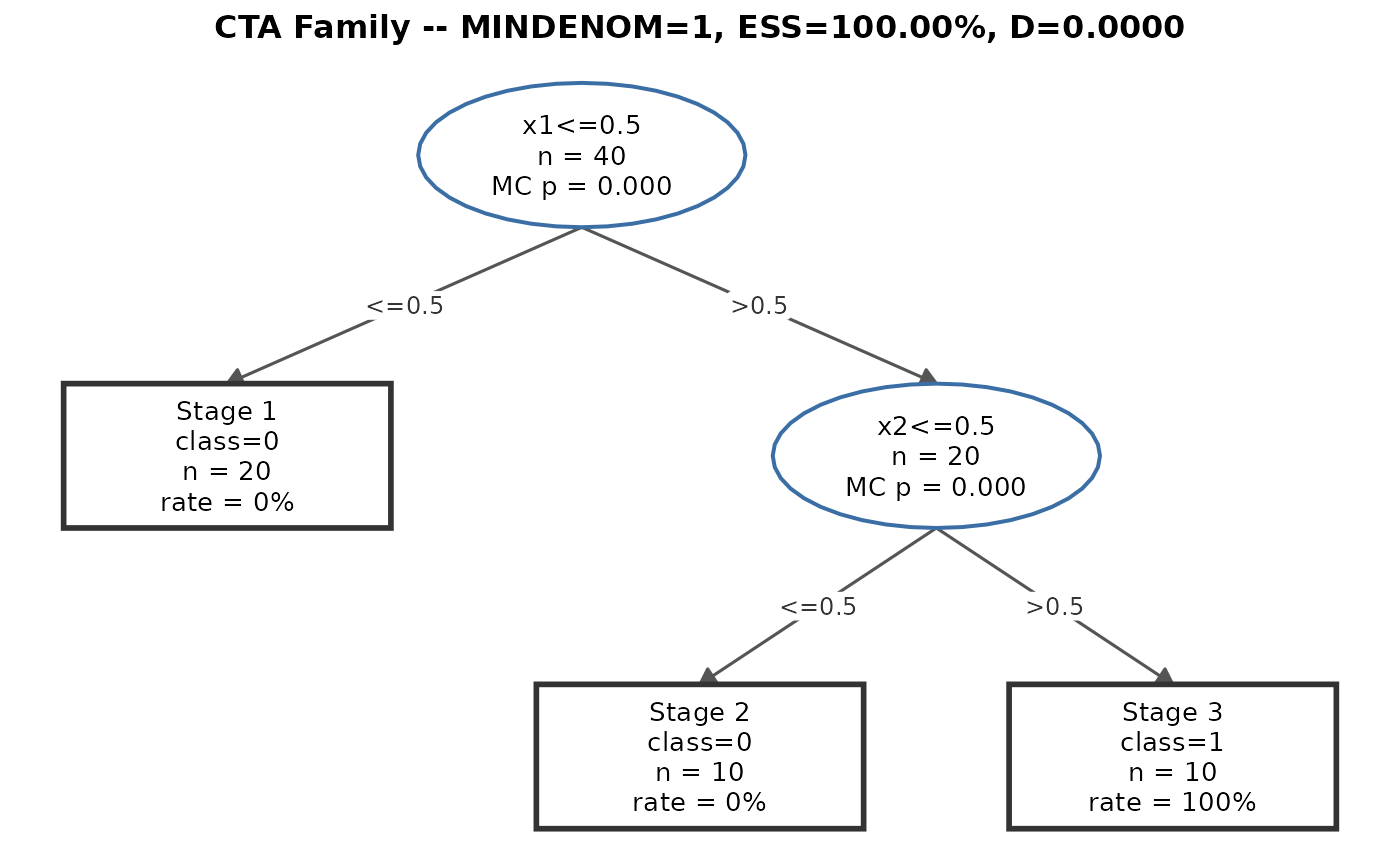
Renders a publication-quality CTA tree diagram for a single member of a
cta_family object (indexed inspection), or a named list of plots for
all members (show_all = TRUE). Requires the ggplot2 package.
Usage
plot_cta_family(
  family,
  index = 1L,
  min_d = FALSE,
  show_all = FALSE,
  layout = c("multipanel", "list"),
  ncol = 1L,
  target_class = 1L,
  color_by = c("none", "target_rate", "prediction"),
  label_detail = c("simple", "full"),
  show_node_ess = FALSE,
  show_p = TRUE,
  show_loo = TRUE,
  main = NULL,
  subtitle = NULL,
  show_rule = TRUE,
  show_metrics = FALSE,
  short_edge_labels = TRUE,
  node_text_size = 3.5,
  edge_text_size = 3.2,
  palette = NULL
)
Arguments
- family
A
cta_familyobject fromcta_descendant_family.- index
Integer or
"min_d"; which family member to render. Default1L. Use"min_d"to render the member with minimum D-statistic. Ignored whenshow_all = TRUE.- min_d
Logical; convenience shorthand for
index = "min_d". WhenTRUE, renders the minimum-D family member regardless ofindex. DefaultFALSE.- show_all
Logical; if
TRUE, render all family members. Output format is controlled bylayout. DefaultFALSE.- layout
Character;
"multipanel"(default, requires patchwork) returns a single combined figure;"list"returns a named list of ggplot objects. Only relevant whenshow_all = TRUE.- ncol
Integer; number of columns in the multipanel grid. Default
1L. Only used whenshow_all = TRUEandlayout = "multipanel".- target_class
Integer; target class for endpoint coloring (default
1L).- color_by
Character; leaf-node fill.
"none"(default),"target_rate", or"prediction".- label_detail
Character;
"simple"(default) or"full".- show_node_ess
Logical; append node ESS to split labels. Default
FALSE.- show_p
Logical; append
MC p = X.XXXto split-node labels. DefaultTRUE.- show_loo
Logical; append LOO status/p to split-node labels. Default
TRUE.- main
Character; plot title. Default: auto-generated with MINDENOM and D.
- subtitle
Character; plot subtitle.
- show_rule
Logical; show edge condition labels. Default
TRUE.- show_metrics
Logical; append ESS/D to subtitle. Default
FALSE.- short_edge_labels
Logical; strip attribute prefix from edge labels. Default
TRUE.- node_text_size
Numeric; text size for node labels. Default
3.5.- edge_text_size
Numeric; text size for edge labels. Default
3.2.- palette
Named list for color overrides.
Value
A ggplot object (single member or multipanel),
or (when show_all = TRUE and layout = "list") a named list
of ggplot objects.
Examples
# \donttest{
if (requireNamespace("ggplot2", quietly = TRUE)) {
  X <- data.frame(x1 = c(rep(0L,20), rep(1L,20)),
                  x2 = c(rep(0L,10), rep(1L,10), rep(0L,10), rep(1L,10)))
  y <- c(rep(0L,30), rep(1L,10))
  fam <- cta_descendant_family(X, y, mc_iter=200L, mc_seed=42L, loo="off")
  p   <- plot_cta_family(fam, index=1L)
  print(p)
}

# }
# }