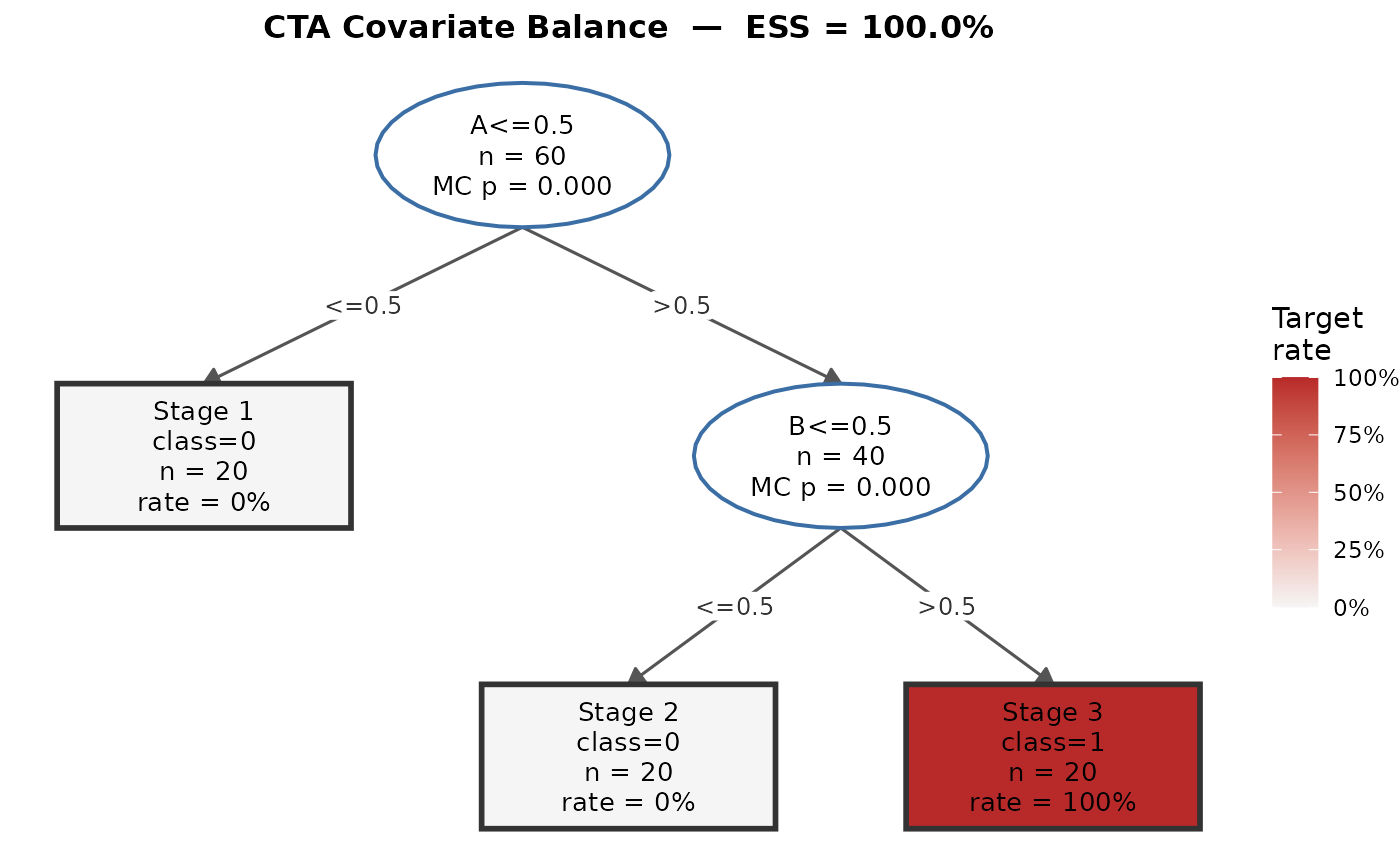
Renders the CTA covariate balance result. When no discriminating tree was
found (status = "no_tree"), a message panel confirms favorable
evidence of multivariable balance under the declared constraints. When a
valid tree or stump was found, the tree diagram is rendered via
plot_cta_tree.
Usage
plot_cta_balance(
  x,
  target_class = 1L,
  color_by = c("target_rate", "prediction", "none"),
  main = NULL,
  subtitle = NULL,
  ...
)
Arguments
- x
A
"cta_balance_plot_data"object fromcta_balance_plot_data, or a"cta_balance_table"object fromcta_balance_table(coerced internally viacta_balance_plot_data; never calls the fitting function).- target_class
Integer; target class for leaf-node coloring. Default
1L.- color_by
Character; leaf-node fill:
"target_rate"(default),"prediction","none".- main
Character; plot title. Default: auto-generated from ESS/WESS.
- subtitle
Character; plot subtitle.
- ...
Additional arguments forwarded to
plot_cta_treewhen a tree is rendered.
Value
A ggplot object.
Details
This function is a pure renderer. It does not fit any CTA models and does
not accept group or X arguments.
Examples
# \donttest{
if (requireNamespace("ggplot2", quietly = TRUE)) {
  X <- data.frame(
    A = c(rep(0L,20), rep(1L,20), rep(1L,20)),
    B = c(rep(0L,20), rep(0L,20), rep(1L,20))
  )
  group <- c(rep(0L, 40), rep(1L, 20))
  ct  <- cta_balance_table(group, X, mindenom = 5L,
                            mc_iter = 200L, mc_seed = 42L)
  cpd <- cta_balance_plot_data(ct)
  p   <- plot_cta_balance(cpd)
  print(p)
}

# }
# }