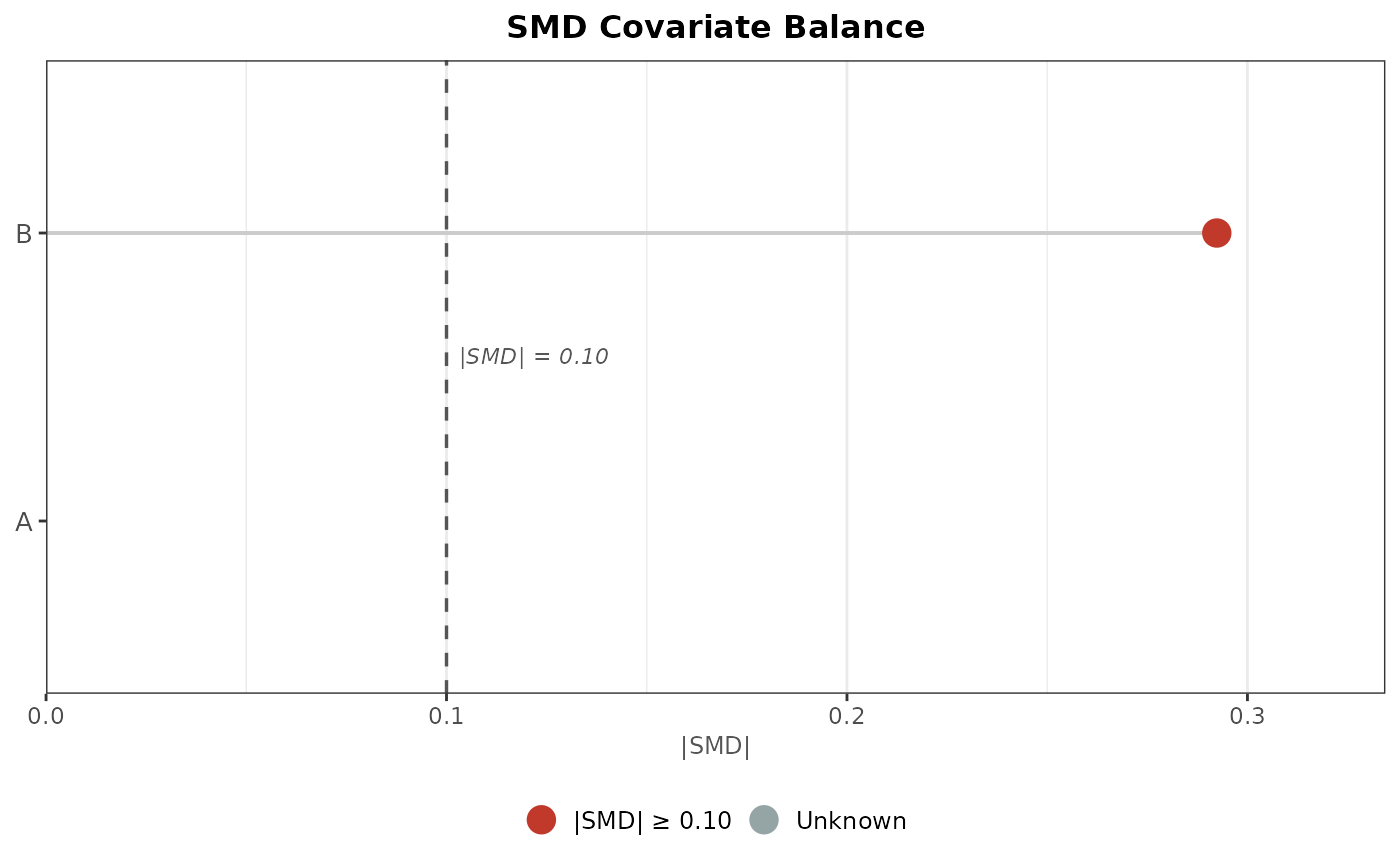
Renders a horizontal dot-plot of absolute standardized mean differences (|SMD|) for each covariate. Vertical reference lines at 0.10 (and optionally 0.20) mark conventional balance thresholds. Points are colored by whether |SMD| < 0.10.
Usage
plot_smd_balance(
  x,
  ref_010 = TRUE,
  ref_020 = FALSE,
  main = NULL,
  subtitle = NULL,
  palette = NULL,
  theme = c("clean", "minimal")
)
Arguments
- x
A
"smd_balance_table"object fromsmd_balance_table.- ref_010
Logical; draw a dashed reference line at |SMD| = 0.10. Default
TRUE.- ref_020
Logical; draw a dotted reference line at |SMD| = 0.20. Default
FALSE.- main
Character; plot title. Default
"SMD Covariate Balance".- subtitle
Character; plot subtitle.
- palette
Named list for color overrides:
imbalanced,balanced,unclassified.- theme
Character;
"clean"(default) or"minimal".
Value
A ggplot object.
Examples
# \donttest{
if (requireNamespace("ggplot2", quietly = TRUE)) {
  group <- c(rep(0L, 20), rep(1L, 20))
  X     <- data.frame(A = c(rep(0L,20), rep(1L,20)),
                       B = rnorm(40))
  smd <- smd_balance_table(group, X)
  p   <- plot_smd_balance(smd)
  print(p)
}

# }
# }