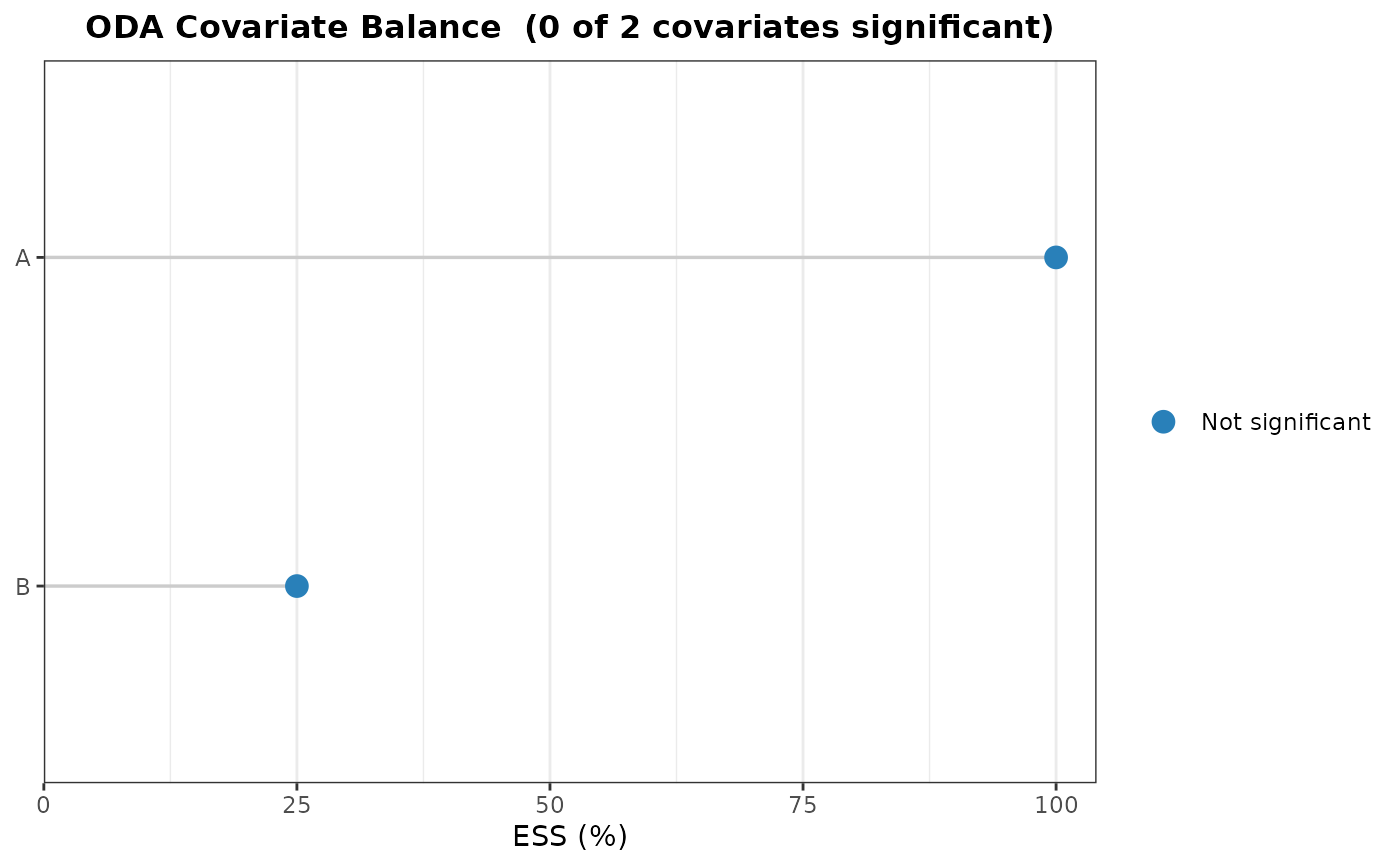
Renders a horizontal dot-plot of ODA-based covariate balance diagnostics.
Each covariate is shown as a point; the x-axis is ESS or WESS (0-100 %),
and point color reflects significance status. The function is a pure
renderer: it does not fit any ODA models and does not accept group
or X arguments. If abs_smd is absent from the plot-data it
is not plotted.
Usage
plot_oda_balance(
  x,
  p_col = "p_mc",
  rank_by = "abs_ess",
  main = NULL,
  subtitle = NULL,
  show_significance = TRUE,
  palette = NULL,
  theme = c("clean", "minimal")
)
Arguments
- x
An
"oda_balance_plot_data"object fromoda_balance_plot_data, or an"oda_balance_table"object fromoda_balance_table(coerced internally viaoda_balance_plot_data; never calls the fitting function).- p_col
Character; which p-value column drives significance colour when coercing from an
oda_balance_table. One of"p_mc"(default),"p_sidak","p_bonferroni". Ignored whenxis alreadyoda_balance_plot_data.- rank_by
Character; sort order when coercing from
oda_balance_table:"abs_ess"(default),"p","abs_smd".- main
Character; plot title. Default: auto-generated summary.
- subtitle
Character; plot subtitle.
- show_significance
Logical; annotate significantly imbalanced covariates with a
"*"label. DefaultTRUE.- palette
Named list for color overrides:
imbalanced,balanced,unclassified.- theme
Character;
"clean"(default,theme_bwbase) or"minimal".
Value
A ggplot object.
Examples
# \donttest{
if (requireNamespace("ggplot2", quietly = TRUE)) {
  group <- c(rep(0L, 20), rep(1L, 20))
  X     <- data.frame(A = c(rep(0L,20), rep(1L,20)),
                       B = rnorm(40))
  bt  <- oda_balance_table(group, X, mcarlo = FALSE, mc_iter = 100L)
  pd  <- oda_balance_plot_data(bt)
  p   <- plot_oda_balance(pd)
  print(p)
}

# }
# }