Plot a fitted CTA tree
plot.cta_tree.RdNative base-R CTA visualization. Calls cta_plot_data for
layout; uses only base graphics - no external package dependencies.
Split (internal) nodes are drawn as ellipses; terminal endpoint
nodes are drawn as rectangles; edges are directed arrows.
Split nodes show the split attribute, node-level ESS or WESS, and
observation count. Without target_class, leaf nodes show the
majority-class prediction and observation count. With target_class,
leaf nodes show the target-class count, percentage, predicted class, and
stage from cta_staging_table. Edge labels show the branch
condition (e.g. "V14<=0.5").
Color note: when target_class is supplied, endpoint fill
colors are assigned by ascending rank of each endpoint's target-class
proportion within this tree. Colors encode relative position in the
endpoint distribution and do not imply clinical thresholds or
categories. Supply a custom palette via endpoint_palette to change
the color encoding. Use show_caption = TRUE to render an explicit
note on the plot.
cta_plot_data is the renderer-independent data contract.
This function (plot.cta_tree) is the current native base-R renderer.
Usage
# S3 method for class 'cta_tree'
plot(x,
     target_class = NULL, class_labels = NULL, digits = 1,
     main = "CTA Tree", show_counts = TRUE, show_stage = TRUE,
     endpoint_palette = NULL, endpoint_fill = "#D9F7E6",
     split_fill = "#D9EAF7", node_col_split = NULL,
     node_col_leaf = NULL, edge_col = "grey40",
     border_col = "grey30", text_col = "black",
     arrow_col = NULL, show_caption = FALSE,
     cex = 0.75, ...)
Arguments
- x
A
cta_treefromoda_cta_fit.- target_class
Integer target class for endpoint annotation; passed to
cta_plot_data.NULL(default) produces a structural plot without endpoint enrichment.- class_labels
Optional display names for class labels; passed to
cta_plot_data. Seecta_plot_datafor accepted formats.- digits
Decimal places for percentage labels in enriched endpoint nodes; passed to
cta_plot_data. Default1.- main
Character plot title. Default
"CTA Tree".- show_counts
Logical; include
n=a/braw counts in endpoint labels whentarget_classis supplied. DefaultTRUE.- show_stage
Logical; include
Stage sline in endpoint labels whentarget_classis supplied. DefaultTRUE.- endpoint_palette
Palette for endpoint fill colors when
target_classis supplied; passed tocta_plot_data.NULLuses the default gradient. Accepts a palettefunction(n)or a character vector of colors.- endpoint_fill
Default fill colour for leaf (terminal) nodes when
target_classisNULL. Default"#D9F7E6"(light green).- split_fill
Fill colour for split (internal) ellipse nodes. Default
"#D9EAF7"(light blue).- node_col_split
Legacy alias for
split_fill; overrides it when non-NULL.- node_col_leaf
Legacy alias for
endpoint_fill; overrides it when non-NULL.- edge_col
Colour for directed edge arrows. Default
"grey40".- border_col
Border colour for all nodes. Default
"grey30".- text_col
Text colour for node labels. Default
"black".- arrow_col
Arrow colour for directed edges.
NULL(default) usesedge_col.- show_caption
Logical; if
TRUEandtarget_classis supplied, adds a bottom caption: "Endpoint fill: relative target-class proportion within this tree. Not a clinical threshold." DefaultFALSE.- cex
Text expansion factor for node labels. Default
0.75.- ...
Unused; included for S3 compatibility.
Value
invisible(pd), where pd is the cta_plot_data
list used to render the plot. The caller can inspect layout coordinates,
enrichment columns, and endpoint annotations from the returned object.
Examples
data(mtcars)
X <- mtcars[, c("cyl", "disp", "hp", "wt")]
y <- as.integer(mtcars$am)
tree <- suppressMessages(
oda_cta_fit(X, y, mindenom = 5L, mc_iter = 500L, mc_seed = 42L,
loo = "off")
)
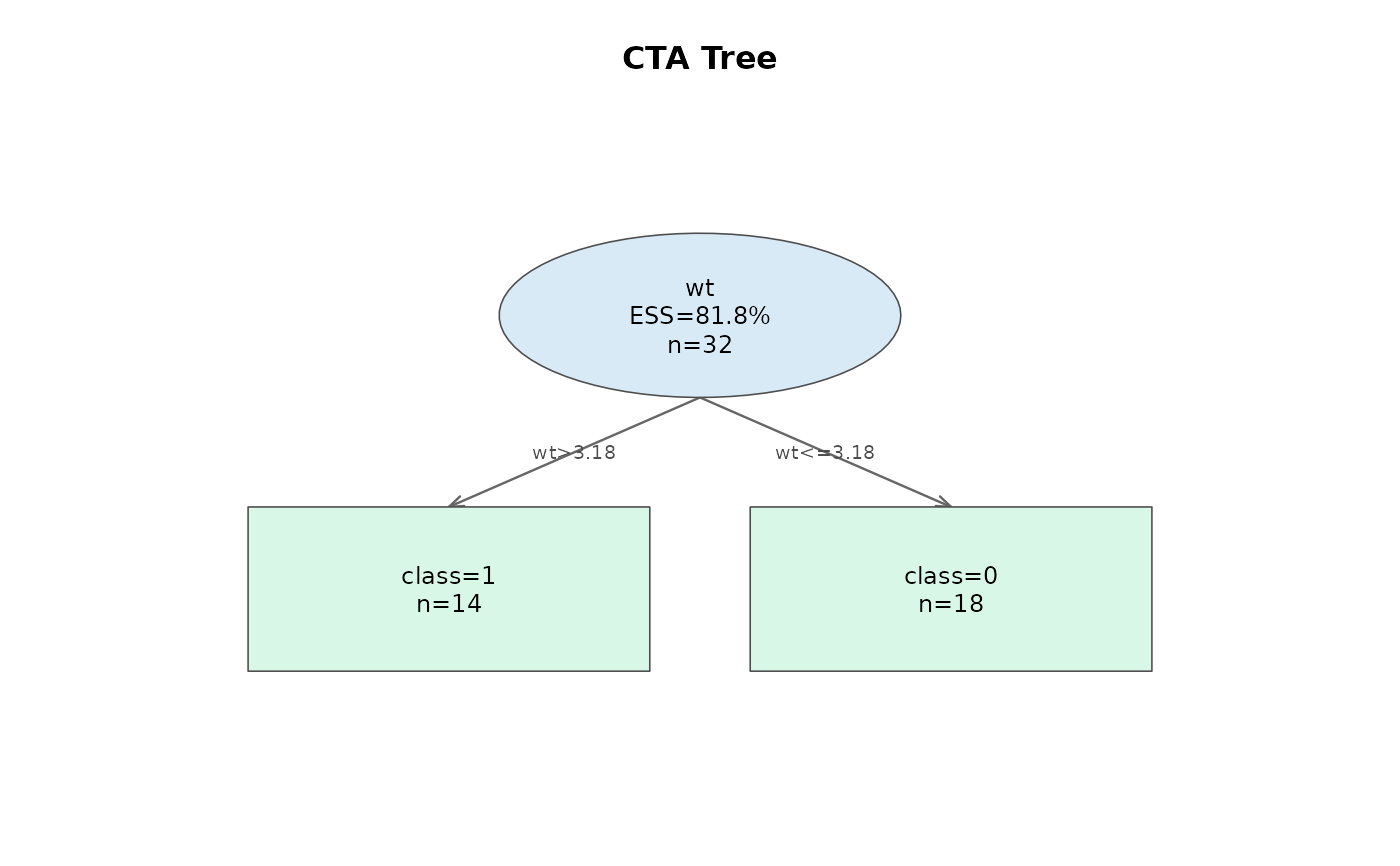
# Structural plot
plot(tree)
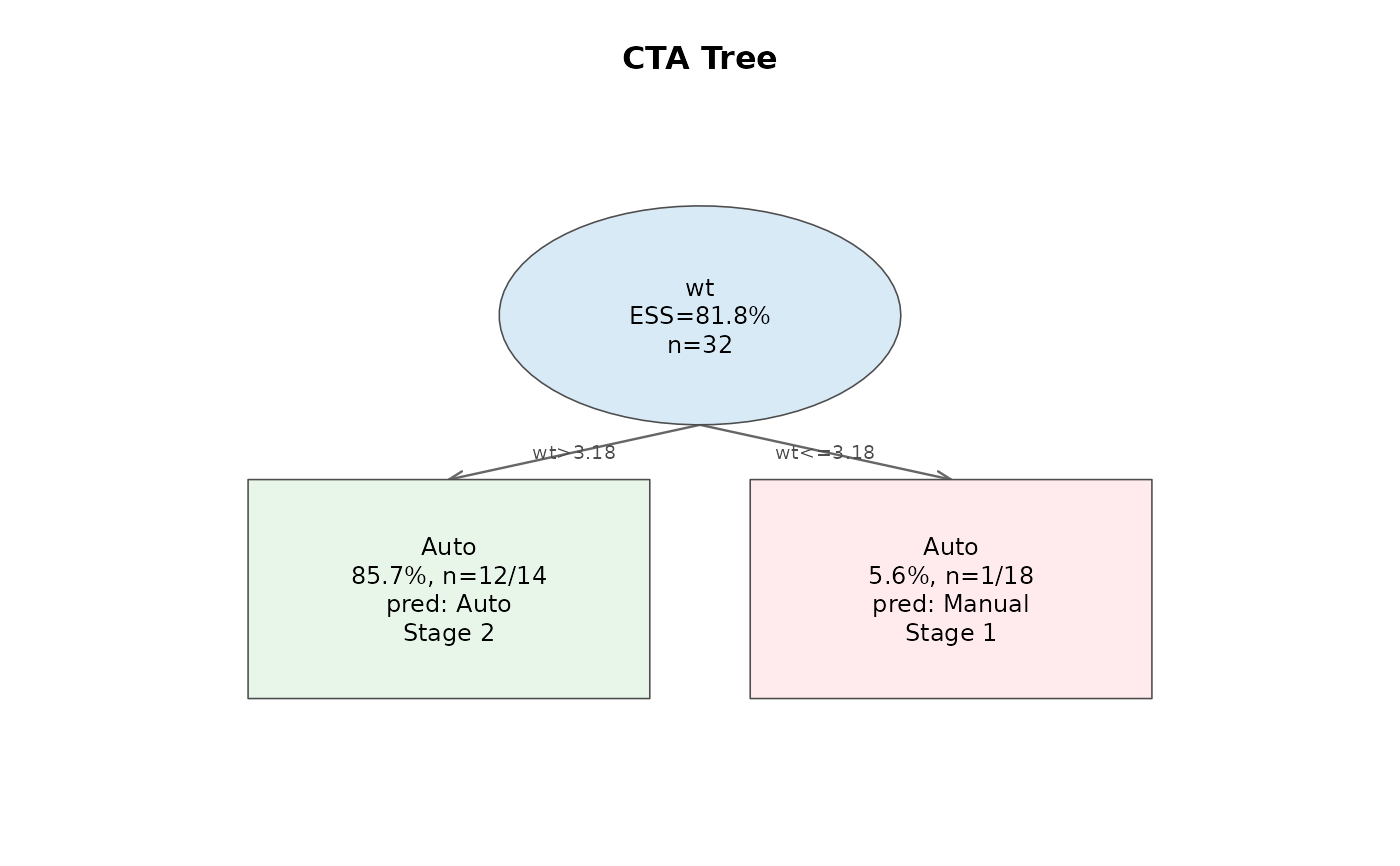
 # Target-class enriched plot with custom labels
plot(tree, target_class = 1L,
class_labels = c("0" = "Manual", "1" = "Auto"))
# Target-class enriched plot with custom labels
plot(tree, target_class = 1L,
class_labels = c("0" = "Manual", "1" = "Auto"))
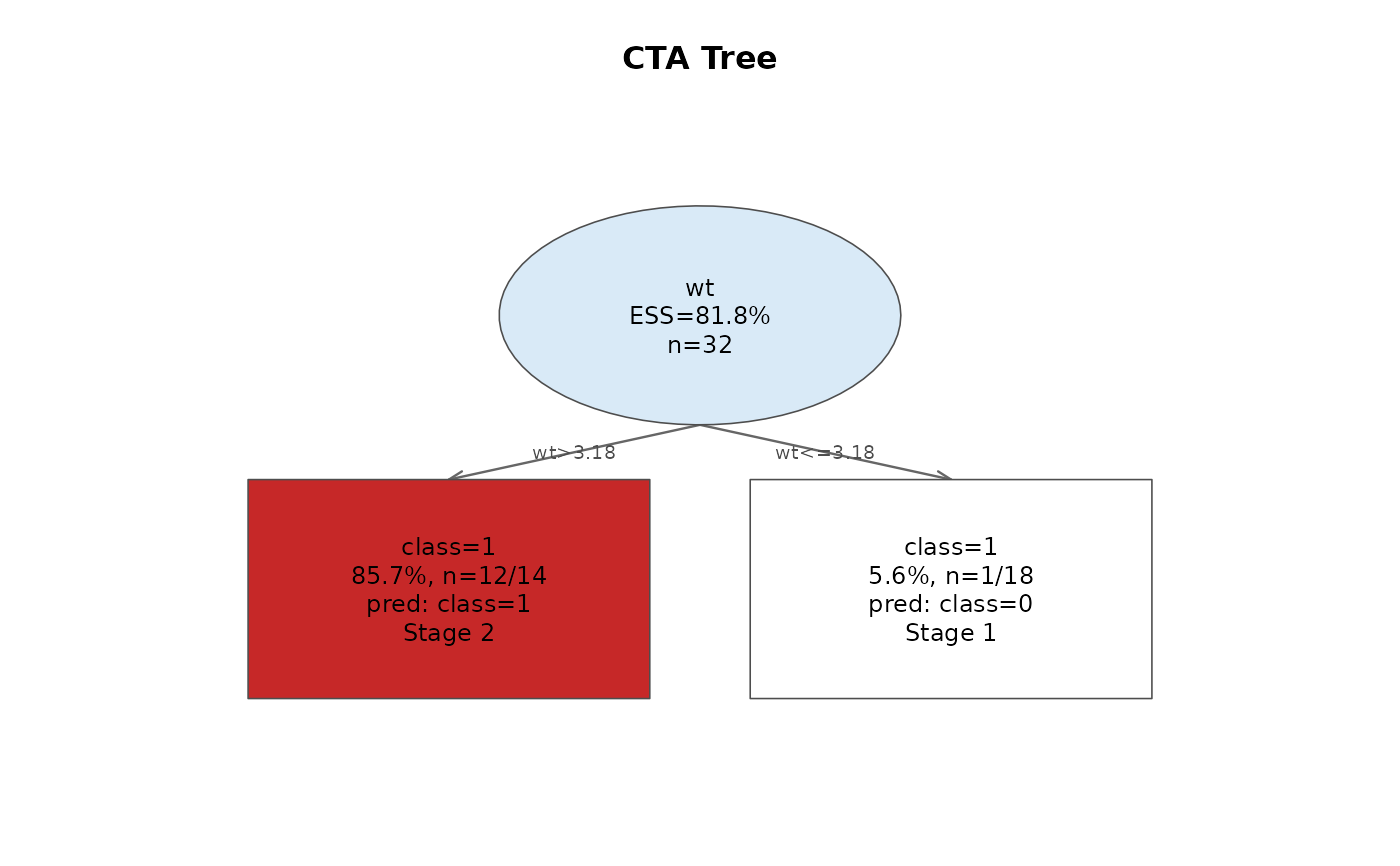
 # Custom palette (white to dark red)
plot(tree, target_class = 1L,
endpoint_palette = c("#ffffff", "#c62828"))
# Custom palette (white to dark red)
plot(tree, target_class = 1L,
endpoint_palette = c("#ffffff", "#c62828"))